Start chat with AI agent
 Speak with AI voice agent
 Book a Demo


Customer Retention Analytics: The Ultimate Guide to Turning Data into Loyalty

Introduction: Why Your Growth Depends on Looking Backward
In the relentless pursuit of growth, the spotlight often shines brightest on customer acquisition. It’s the celebrated metric, the headline number. But in the hyper-competitive landscape of 2026, we know the truth: while acquisition might get the glory, it’s customer retention that builds the empire.
This is where customer retention analytics comes in. It’s not a complex data science project reserved for specialists; it’s a practical, strategic toolkit for unlocking sustainable growth. It’s about looking at the customers you already have to understand why they stay, predict when they might leave, and discover how to create experiences that earn their long-term loyalty.
The core challenge for most brands isn’t a lack of data, but a lack of connection. You have web analytics, app engagement metrics, CRM data, and conversation logs from channels like WhatsApp. Yet, this information often lives in isolated silos, rendering it useless for creating a coherent, actionable strategy. Without a unified view, you’re just guessing.
This guide is designed to change that. We will walk you through the essential metrics and proven strategies for world-class customer retention analysis. More importantly, we’ll show you how a unified platform like indigitall can turn those powerful insights into immediate, automated actions, transforming your data from a passive resource into your most active growth driver.

What is Customer Retention Analytics?
Customer Retention Analytics is the strategic process of collecting, analyzing, and interpreting customer data to deeply understand behavior, predict churn, and pinpoint the exact drivers of long-term loyalty. In 2026, this goes far beyond simple historical reporting; it’s about leveraging predictive AI to forecast future actions and proactively engage customers before they even think of leaving.
Think of it this way: customer acquisition analytics is like planning a successful first date—it’s focused on making that initial connection. Customer retention analytics, however, is about nurturing the entire long-term relationship. It’s the ongoing conversation that turns a first-time buyer into a lifelong brand advocate.
A powerful retention strategy is built on a foundation of both quantitative and qualitative data. This creates a complete, 360-degree view of the customer experience that numbers alone cannot provide.
- Quantitative Data (The ‘What’): This includes measurable metrics like purchase frequency, average order value (AOV), app session duration, and engagement rates with push notifications or in-app messages. These hard numbers tell you what customers are doing.
- Qualitative Data (The ‘Why’): This is the human context behind the numbers. It includes Net Promoter Score (NPS) feedback, customer support ticket sentiment, survey responses, and even conversational data from interactions with AI Agents on channels like WhatsApp.
In today’s hyper-connected ecosystem, these data points are generated across a vast landscape of touchpoints. A truly effective Global Omnichannel Strategy requires a platform that can centralize this information, breaking down silos between your app, website, WhatsApp Business account, and mobile wallet. Only with a unified view can you orchestrate the seamless, personalized Customer Journeys that drive meaningful retention.
The Essential Customer Retention Metrics You Must Track
Before you can optimize your retention strategy, you need a clear, data-driven picture of your current performance. In 2026, relying on gut feelings or isolated channel data is a recipe for failure. The metrics below form the foundational dashboard for any modern business, providing the insights needed to transform raw data into unwavering customer loyalty.
Think of this not as a simple checklist, but as the real-time health monitor for your customer base. A unified platform, where data from all touchpoints flows into a single view, is no longer a luxury—it’s essential. This is where an integrated solution like the indigitall console provides a critical advantage, turning complex calculations into actionable insights.
Core Health Metrics: Retention and Churn
These two metrics are the opposite sides of the same coin and provide the highest-level view of your customer loyalty.
- Customer Retention Rate (CRR): This is the ultimate measure of how well you’re keeping your customers. It’s the percentage of existing customers who remain with you over a specific period. A high CRR is a direct indicator of a healthy business with a strong product-market fit and a satisfying customer experience.Calculation: [((Number of Customers at End of Period – Number of New Customers Acquired) / Number of Customers at Start of Period)] x 100
- Customer Churn Rate: This is the rate at which your customers are leaving. While some churn is inevitable, a rising churn rate is an urgent red flag, signaling potential issues with your product, pricing, or customer service. Reducing churn by even a few percentage points can have a massive impact on your bottom line.Calculation: [(Number of Customers Lost During Period / Number of Customers at Start of Period)] x 100
Value-Based Metrics: The Financial Impact
Understanding which customers are most valuable allows you to focus your retention efforts where they will generate the highest return on investment.
- Customer Lifetime Value (CLV or LTV): This is the total predicted revenue a single customer will generate throughout their entire relationship with your brand. CLV is the north star metric for strategic decisions, helping you determine how much you can afford to spend on acquisition and, more importantly, on retention. The goal of every Customer Journey should be to maximize LTV.Calculation: (Average Purchase Value x Average Purchase Frequency Rate) x Average Customer Lifespan
- Repeat Purchase Rate (RPR): This simple metric reveals the percentage of your customers who are willing to come back for a second purchase. It’s a powerful early indicator of customer satisfaction and brand loyalty. A strong RPR suggests your initial experience delivers on its promise, encouraging a continued relationship.Calculation: (Number of Customers with More Than One Purchase / Total Number of Customers) x 100
Engagement Metrics: Measuring Customer Stickiness
Engagement is the leading indicator of retention. An engaged customer is one who actively and regularly interacts with your brand across your digital ecosystem. An effective Global Omnichannel Strategy is key to boosting these numbers.
- Purchase Frequency (PF): This metric shows how often, on average, a customer makes a purchase from you in a given timeframe. Increasing purchase frequency is a primary goal for automated marketing campaigns, like sending a perfectly timed WhatsApp offer or a rich push notification about a new product drop.Calculation: Total Number of Orders / Total Number of Unique Customers
- Daily Active Users (DAU) & Monthly Active Users (MAU): Crucial for app-based businesses, retailers, and banks, this metric measures the “stickiness” of your digital properties. The DAU/MAU ratio tells you what percentage of your monthly users engage on a daily basis. High engagement across your app and website is a strong predictor of long-term retention and higher LTV.Calculation: Simply a count of unique users who perform an action in a day (DAU) or a 30-day period (MAU).
Tracking these metrics separately is a start, but their true power is unlocked when viewed together in a centralized dashboard. This holistic view allows you to see how a dip in engagement might predict future churn, or how a successful Customer Journey boosts both Repeat Purchase Rate and overall LTV.
Core Business Metrics
While granular data provides the tactical details, a few high-level metrics serve as the north star for your entire retention strategy. In 2026, these are the core business indicators that directly reflect the health of your customer relationships and predict future revenue. Mastering them is essential for communicating the value of your efforts to the C-suite.
- Customer Churn RateThis is the percentage of customers who cease doing business with you during a specific period. Think of it as the ultimate health indicator; if your churn rate is high, it’s a sign that something is fundamentally broken in the customer experience, regardless of your acquisition numbers.
Proactively identifying at-risk customers is the first step to reducing churn. A unified customer data platform is critical here, allowing you to spot churn signals across your entire ecosystem—from decreased app usage to low open rates on web push notifications. This is where an orchestrated Customer Journey can automatically trigger a “win-back” campaign via a high-impact channel like WhatsApp Business.
- Customer Lifetime Value (CLV)CLV represents the total revenue you can reasonably expect from a single customer account throughout your business relationship. In today’s competitive landscape, focusing on CLV is far more profitable than a relentless, high-cost pursuit of new customers.
Maximizing CLV is about deepening relationships through personalized engagement. An effective Global Omnichannel Strategy nurtures customers with relevant up-sell and cross-sell opportunities, transforming one-time buyers into high-value loyalists. Orchestrating these interactions from a single console ensures a consistent and valuable experience, directly boosting your bottom line.
- Repeat Purchase Rate (RPR)This metric measures the percentage of your customer base that has made more than one purchase. For retail, e-commerce, and any transaction-based business, RPR is the engine of sustainable growth. It’s the tangible proof that your product and experience are compelling enough to bring customers back.
Driving repeat purchases hinges on a seamless post-purchase experience. Imagine a Customer Journey where an order confirmation is sent via email, a shipping update is delivered via App Push, and a follow-up satisfaction survey arrives via WhatsApp. This level of automated, multi-channel communication builds trust and keeps your brand top-of-mind, paving the way for the next sale.
Customer Engagement & Satisfaction Metrics
While behavioral metrics tell you what your customers are doing, engagement and satisfaction metrics reveal how they feel. In 2026, capturing this sentiment is non-negotiable for building lasting relationships and proactively reducing churn. These qualitative insights are the emotional layer of your retention analytics.
Net Promoter Score (NPS): The Loyalty Barometer
NPS is the classic metric for gauging overall customer loyalty. It’s based on a single, powerful question: “On a scale of 0-10, how likely are you to recommend our brand to a friend or colleague?” This simple query segments your audience into Promoters, Passives, and Detractors, giving you a high-level snapshot of brand health and growth potential.
A Global Omnichannel Strategy allows you to collect NPS data at the most impactful moments. Imagine triggering an NPS survey via an in-app message after a user has been active for 30 days, or through WhatsApp after a successful customer service resolution. The key is to make it seamless within their chosen channel.
Customer Satisfaction (CSAT): The Instant Feedback Loop
Where NPS measures long-term loyalty, CSAT measures short-term, transactional happiness. It asks, “How satisfied were you with your recent [interaction/purchase/support chat]?” and provides immediate feedback on specific touchpoints within your Customer Journey.
This metric is invaluable for optimizing processes. If a specific step in your checkout flow consistently receives low CSAT scores via a follow-up web push survey, you’ve pinpointed a critical friction point that needs immediate attention. The indigitall console allows you to orchestrate these automated, real-time feedback requests with ease.
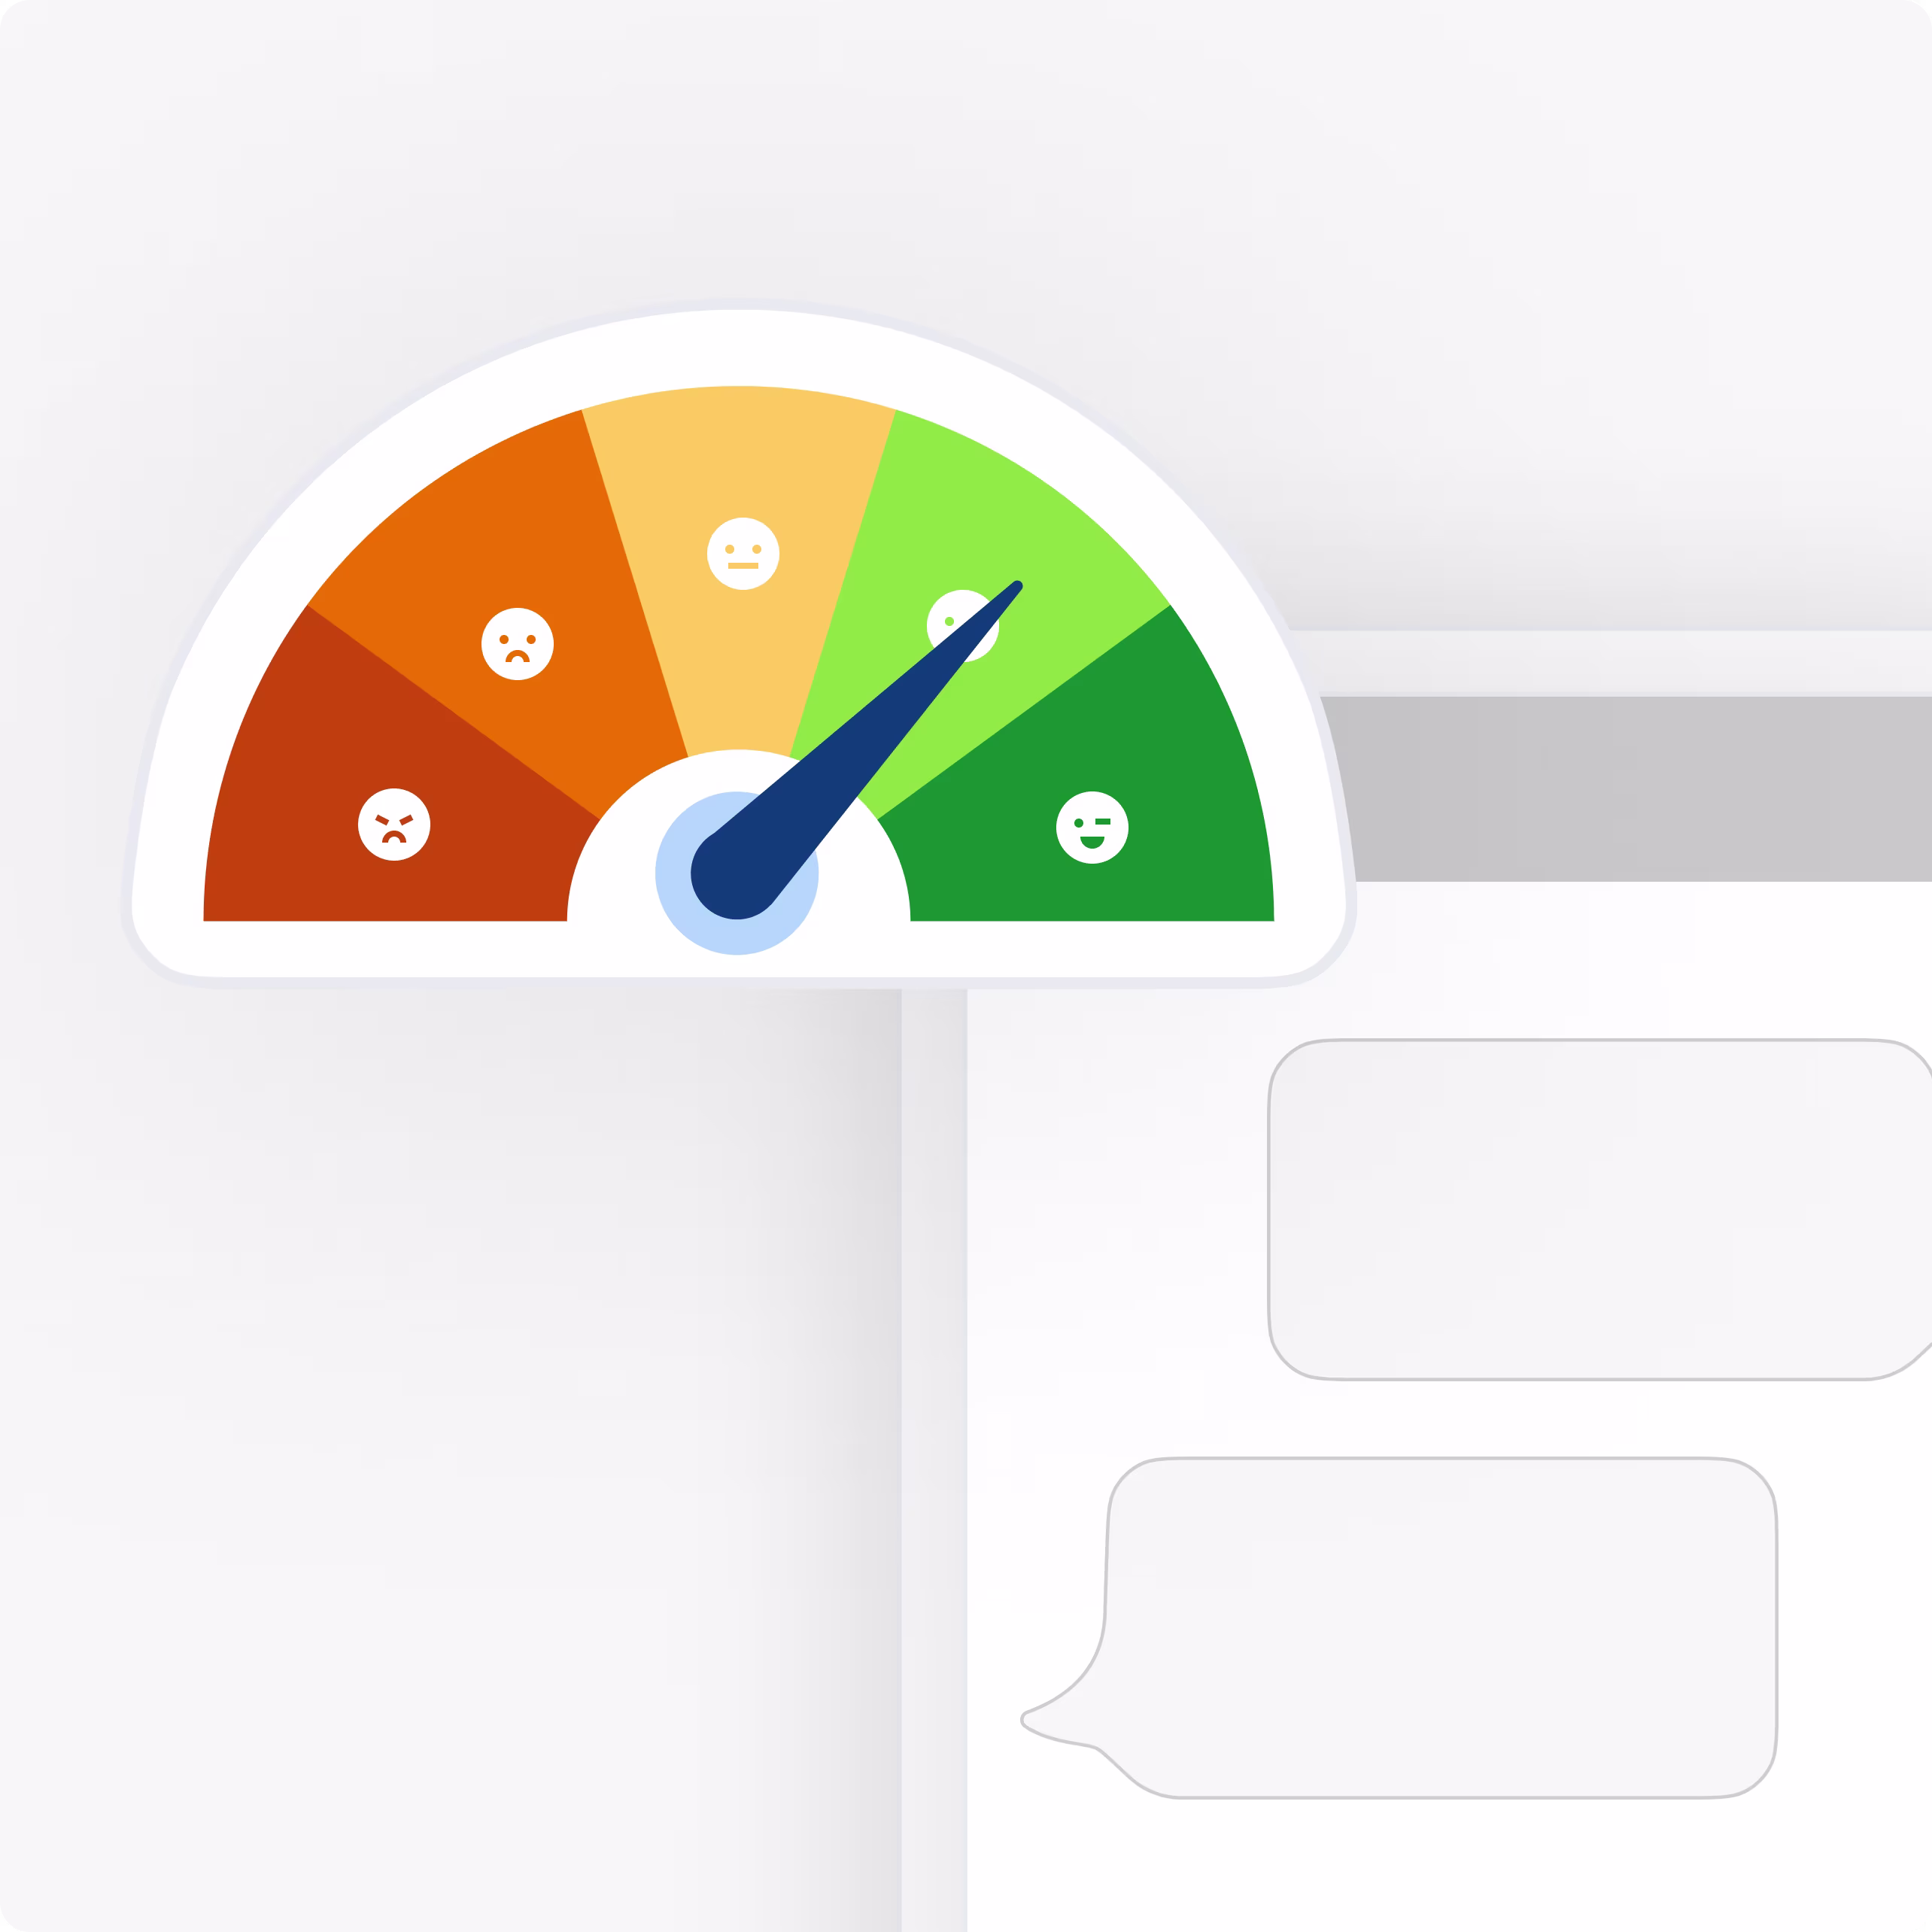
Customer Health Score: The Predictive Powerhouse of 2026
The most advanced metric in the modern marketer’s toolkit is the Customer Health Score. This isn’t a single survey; it’s a composite, predictive score that synthesizes multiple data points into a single, actionable indicator of account health. It combines behavioral data (product usage, login frequency) with engagement data (NPS/CSAT scores, support ticket volume).
Calculating this score manually is a relic of the past. Today’s marketing automation platforms leverage AI to analyze these diverse signals in real-time, assigning a dynamic health score that predicts churn risk or identifies upsell opportunities before they become obvious. This allows you to orchestrate proactive interventions, like sending a special offer to a “cooling” customer or inviting a “healthy” customer to a loyalty program.
The accuracy of a Customer Health Score depends entirely on a unified data ecosystem. An all-in-one solution is critical, as it ensures that data from your app, website, AI agents, and WhatsApp conversations are all contributing to a single, coherent and powerfully predictive customer view.
A Step-by-Step Guide to Performing Retention Analysis
Understanding the theory behind retention analytics is one thing; putting it into practice is where market leaders separate themselves in 2026. This step-by-step guide provides a practical framework for transforming raw data into a powerful, loyalty-driving engine. We’ll move from defining goals to activating insights in real-time.
Step 1: Define Your Key Retention Objectives
Before you dive into a sea of data, you must define what you’re looking for. A clear objective acts as your compass, preventing analysis paralysis and ensuring your efforts are tied to tangible business outcomes. Start by asking a precise, high-value question.
Your objective could be to understand:
- Why did user churn increase by 5% in the first quarter of 2026 compared to last year?
- Which acquisition channel (e.g., Organic Search, Social Ads, App Store) delivers customers with the highest Lifetime Value (LTV) after six months?
- What is the impact of our new generative AI product feature on second-purchase rates?
- Which user behaviors are the strongest predictors of long-term loyalty?
Step 2: Consolidate Your Omnichannel Data
The single greatest challenge for most brands is the fragmented nature of customer data. Information lives in silos: your CRM, your app analytics platform, your web server logs, your point-of-sale system, and your third-party communication tools. To get a true picture of retention, you need a single customer view.
This means centralizing behavioral data (clicks, app opens, feature usage), transactional data (purchases, subscription renewals), and channel interaction data (push notification opens, WhatsApp replies). A unified platform is no longer a luxury; it’s a necessity for a coherent Global Omnichannel Strategy.
Solutions like the indigitall platform act as the central nervous system for this data, seamlessly integrating events from every touchpoint—App, Web, SMS, Mobile Wallet, and WhatsApp—to build a comprehensive profile for every user.
Step 3: Select the Right Analysis Model
With your data unified and your objective clear, you can now apply a structured model to find answers. Two of the most powerful and widely-used models for retention analysis are Cohort Analysis and RFM Analysis.
- Cohort Analysis: This involves grouping users by a shared characteristic, most often their sign-up date (e.g., all users who joined in the first week of March 2026). You then track this group’s retention rate over time. It’s incredibly effective for measuring the impact of product updates or specific marketing campaigns on user loyalty.
- RFM (Recency, Frequency, Monetary) Analysis: This classic model segments users based on three key data points: how recently they made a purchase, how frequently they purchase, and how much money they spend. It’s a fast and effective way to identify your most valuable customers, those at risk of churning, and new users with high potential.
Step 4: Segment Your Audience for Precision Targeting
An overall retention rate of 85% might sound good, but it hides critical truths. That average could be composed of hyper-loyal VIPs and a huge group of users on the verge of churning. Meaningful action requires segmentation.
Using your analysis, create dynamic segments that you can act on. The indigitall console allows you to build these segments based on any combination of attributes and real-time behaviors, such as “High-Spenders Who Haven’t Visited in 30 Days” or “New Users Who Abandoned Their First Cart.”
Step 5: Visualize Your Findings in Actionable Dashboards
Raw spreadsheets of data rarely inspire action. To communicate your findings and gain buy-in from stakeholders, you must visualize the data. Dashboards and charts translate complex numbers into clear, compelling stories.
A modern customer engagement platform should provide this out of the box. Look for built-in reporting that tracks cohort retention curves, segment growth, and campaign performance in real-time, making it easy to monitor KPIs and share progress across the organization.
Step 6: Formulate Data-Driven Hypotheses
Your analysis has revealed an insight. Now, turn that insight into a testable hypothesis. This is the critical bridge between data and strategy, where you propose a specific action designed to influence a specific metric.
Your hypotheses might look like this:
- Insight: Users who enable push notifications in their first session have a 30% higher 90-day retention rate.Hypothesis: We believe that triggering a personalized welcome Customer Journey via push notification will increase overall 90-day retention by 5%.
- Insight: Our “At-Risk” RFM segment has a 40% churn rate.Hypothesis: We believe a proactive WhatsApp message with an exclusive offer sent to this segment will reduce their churn rate by 15%.
Step 7: Activate, Test, and Orchestrate with Customer Journeys
Finally, it’s time to act. Analysis without activation is an academic exercise. This is where you leverage a marketing automation and Customer Journey orchestration tool to bring your hypotheses to life.
Within the indigitall console, you can instantly translate your segments and hypotheses into automated, omnichannel workflows. For your “At-Risk” segment, you could build a Customer Journey that automatically sends a rich push notification. If it’s not opened within 24 hours, the journey can trigger a follow-up message on WhatsApp, ensuring your message is delivered through the user’s preferred channel.
Crucially, you can A/B test every element of this journey—the channel, the timing, the offer, even different message variations generated by AI—to continuously learn and optimize. This closes the loop, turning analytical insights into measurable improvements in customer loyalty and revenue.
Step 1: Collect and Consolidate Your Data (The Unification Challenge)
Before you can analyze anything, you need a clear, complete picture of your customer. In 2026, the primary obstacle to achieving this is not a lack of data, but its overwhelming fragmentation. Your customer information is likely scattered across a dozen siloed systems: your CRM, your analytics platform, your helpdesk software, your e-commerce engine, and separate tools for each communication channel.
This data disarray creates a fractured and incomplete view of the customer. Your marketing team sees campaign interactions, while your support team sees service tickets. Neither has the full context, leading to disjointed experiences that actively harm retention efforts.
To build a foundation for powerful retention analytics, you must first solve this unification challenge. The goal is to create a single source of truth where every interaction, regardless of the channel, contributes to a holistic customer profile. This is where a unified customer engagement platform becomes mission-critical.
The indigitall platform is engineered to break down these silos from the ground up. Instead of trying to bolt on separate tools for outbound marketing (like App Push and WhatsApp campaigns) and inbound support (like AI Agents), we bring them into a single, cohesive ecosystem. Every touchpoint is captured and contextualized in real time.
This approach transforms your data from a scattered liability into your most powerful strategic asset. When an AI Agent resolves an issue, that data can immediately inform the next marketing Customer Journey. This is the foundation of a Global Omnichannel Strategy, enabling you to orchestrate truly seamless experiences that foster deep-seated customer loyalty.
Step 2: Segment Your Customers for Deeper Insights
Once you have a clean, consolidated data stream, the next crucial step is to move beyond averages. In 2026, treating your entire customer base as a monolith is a fast track to irrelevance. Segmentation is the art and science of dividing your audience into distinct groups based on shared characteristics, transforming raw data into actionable intelligence.
This process allows you to tailor your messaging, offers, and Customer Journeys with surgical precision. A message that resonates with a new user in Madrid will likely differ from one meant for a VIP customer in Mexico City. Effective segmentation is the foundation of true personalization and a cornerstone of any successful retention strategy.
Key Segmentation Models for 2026:
- Behavioral Segmentation: This is where the deepest insights lie. Group customers based on their actions: purchase frequency, average order value (AOV), features used in your app, last activity date, or products browsed. A unified platform like indigitall makes tracking these behaviors across your app, website, and even WhatsApp seamless.
- Engagement-Based Segmentation: Who are your most active users? Segment customers by their interaction with your communications. Group them by who consistently opens App Push Notifications, responds to WhatsApp Business messages, or clicks through from Web Push. This data is critical for optimizing your Global Omnichannel Strategy.
- Predictive & AI-Powered Segmentation: Leverage the power of generative AI to identify customers at high risk of churning before they leave. Conversely, build segments of users with the highest predicted lifetime value (LTV) so you can deliver premium experiences through personalized Customer Journeys.
Go Deeper with Cohort Analysis
While segmentation gives you a snapshot in time, cohort analysis provides a moving picture. A cohort is a group of users who share a common characteristic over time, most often their start date. For example, all customers who made their first purchase in January 2026 form a single cohort.
By tracking these cohorts, you can answer critical questions: Did the users we acquired during our Q1 campaign retain better than those from Q4 2025? How did our new app onboarding Customer Journey impact the retention rate of the February cohort? This analysis reveals the long-term impact of your strategies, allowing you to double down on what works and refine what doesn’t.
Orchestrating this level of analysis and subsequent action is exponentially simpler with an all-in-one solution. The ability to define a segment within the indigitall console and immediately launch a targeted, omnichannel campaign to that specific group is what separates market leaders from the rest.
Step 3: Identify Patterns and Predict Churn with AI
Once you have your key retention metrics and customer segments, the next frontier is moving from historical analysis to predictive action. In the fast-paced digital ecosystem of 2026, waiting for a customer to become inactive is waiting too long. The goal is to identify the subtle behavioral patterns that precede churn and intervene before it happens.
These indicators are rarely isolated events. A customer doesn’t just decide to leave overnight. Instead, they leave a trail of digital breadcrumbs across your entire omnichannel ecosystem. Manually connecting these dots is nearly impossible, but they are clear signals to a trained AI.
Common predictive churn indicators include:
- A noticeable drop in app logins or session duration over a 14-day period.
- Consistently ignoring personalized rich push notifications that were previously opened.
- A decline in purchase frequency or a drop in average transaction value.
- Negative sentiment detected by an AI Agent during a WhatsApp support conversation.
- Opting out of a single channel (like web push) while engagement on others remains static.
This is where the power of an integrated platform becomes a true competitive advantage. This is precisely why we built indigitall AI, a powerful predictive engine designed to be used directly by marketers and CRM managers, no data science degree required.
Because indigitall is an all-in-one solution, it captures every interaction across your app, website, WhatsApp, and Mobile Wallet. Our AI analyzes this continuous stream of first-party data in real-time, identifying complex correlations between behaviors that signal a customer is drifting away.
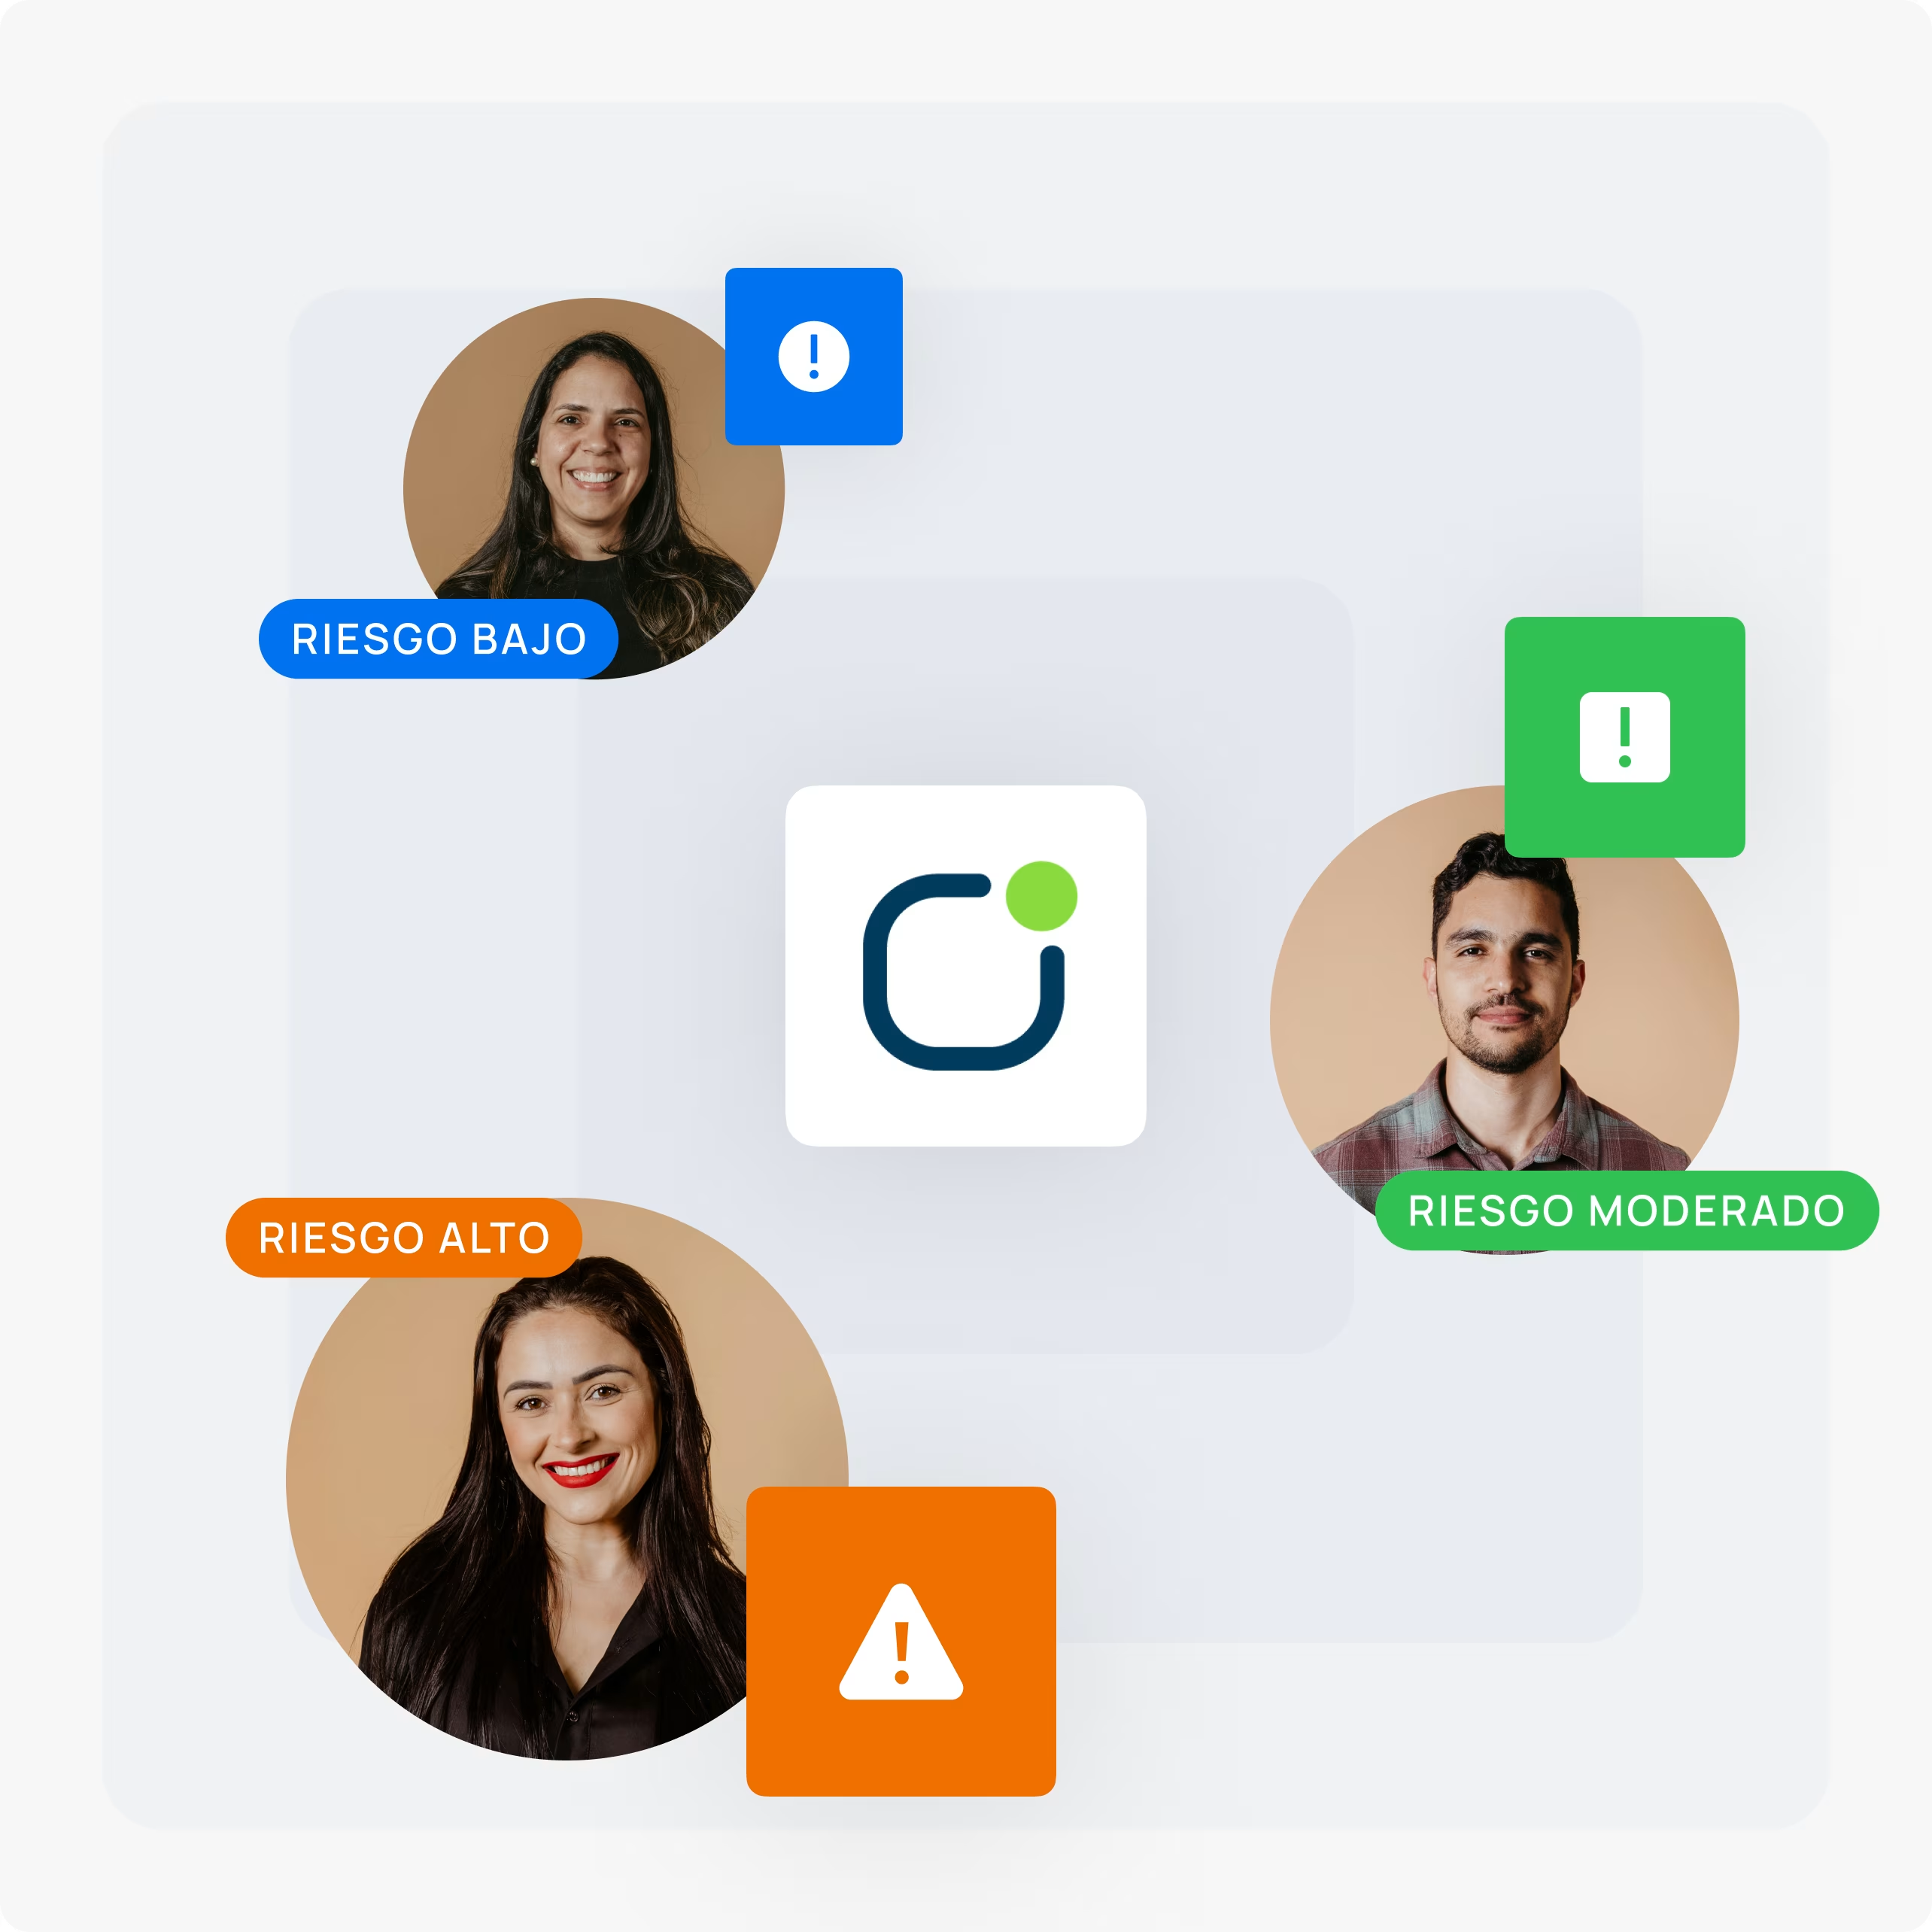
The result is a dynamic ‘churn score’ calculated for every user profile in the indigitall console. This score, from 0 to 100, represents the statistical probability that a customer will become inactive. A rising score is an early warning system, flagging at-risk users long before they hit your churn metric threshold.
With this predictive insight, you can shift from a reactive to a proactive retention strategy. Instead of analyzing why a segment churned last quarter, you can now automatically trigger a preventative Customer Journey for users whose churn score crosses a certain threshold this week, turning powerful analytics into immediate, revenue-saving action.
Step 4: Take Action and Close the Loop
Data analysis provides the map, but it’s action that drives the vehicle forward. In the competitive landscape of 2026, the insights gleaned from your retention analytics are worthless if they remain confined to a dashboard. The critical final step is to “close the loop” by translating those insights into tangible, automated, and personalized customer interactions.
This action can take many forms depending on the segment and the insight. It might be a targeted re-engagement campaign for users showing early signs of dormancy, a personalized discount to reward a high-value customer, or even an alert for a customer success manager to personally reach out to a high-risk account.
This is where the power of an integrated platform becomes a true competitive advantage. Within the indigitall console, an analytical insight—like a predictive churn score—is not just a number. It is an immediate and actionable trigger for a Customer Journey.
Imagine our predictive AI identifies a cohort of retail app users whose engagement score has dropped by 30% in the last week. Instead of manually exporting a list and building a separate campaign, you can have a pre-built workflow that automatically activates:
- Instant Trigger: The moment a user’s score drops below your defined threshold, they enter an automated re-engagement Customer Journey.
- Omnichannel Orchestration: The journey could begin with a friendly check-in via our native WhatsApp Business integration, asking, “We’ve missed you! Need help finding the latest deals?”
- Intelligent Follow-up: If the user doesn’t engage, the system can wait 48 hours and then send a rich App Push Notification with a compelling, personalized offer based on their browsing history, directly encouraging them to return.
By closing the loop directly within the same ecosystem where your analytics live, you eliminate friction and delays. You transform passive data into proactive, revenue-protecting actions that form the core of a successful Global Omnichannel Strategy, ensuring no customer insight ever goes to waste.
The Indigitall Difference: From Fragmented Data to Unified Action
In 2026, customer retention analytics is no longer just about observing data; it’s about activating it in real-time. The gap between insight and action is where loyalty is either won or lost. This is where the architectural choice of your customer engagement platform becomes a critical competitive differentiator.
For years, the standard approach involved a fragmented tech stack. A company might use one platform for marketing automation, another for its customer support chatbot, and a third for transactional alerts. This creates invisible walls between departments and, more importantly, between customer interactions, leading to a disjointed and often frustrating experience.
The indigitall platform is engineered to dismantle these silos. We provide a single, unified ecosystem where marketing, transactional, and conversational interactions coexist. This integrated approach transforms fragmented data points into a coherent, actionable strategy that fuels a truly global Omnichannel experience.
- Single Customer View: By consolidating data from App Push, Web Push, WhatsApp Business, AI Agents, and Mobile Wallet, you gain a holistic understanding of every user, all managed from the indigitall console.
- Intelligent Journey Orchestration: Our platform doesn’t just send messages; it orchestrates conversations. A Customer Journey can automatically pause marketing communications to a user who has an open support ticket, ensuring your brand is always context-aware.
- Operational Efficiency: Managing a single platform reduces complexity, lowers overhead, and empowers your teams to build seamless campaigns without juggling multiple tools and logins.
- Enhanced Personalization: With access to the full spectrum of customer interactions, from campaign clicks to AI Agent conversations, you can power hyper-personalized experiences that drive real engagement and boost customer lifetime value.
Consider a practical scenario. With a fragmented stack, a banking customer who just had a frustrating support chat about a transaction could immediately receive an automated push notification promoting a new credit card. This lack of awareness erodes trust. In contrast, the indigitall ecosystem recognizes the support interaction, suppresses the promotional message, and instead triggers a follow-up via WhatsApp to confirm the issue was resolved.
This is the fundamental shift from fragmented data to unified action. It’s about building an intelligent, responsive system that honors the customer’s real-time context. This is the new standard for retention, and it’s the core of the indigitall difference.
The Problem with Siloed Analytics
By 2026, the power of dedicated outbound marketing platforms is undeniable. Tools like Braze, Insider, and Salesforce Marketing Cloud have become masters at orchestrating sophisticated, multi-step marketing campaigns that drive initial conversion and engagement. They excel at the “push” part of the communication equation.
The critical blind spot, however, lies in what they don’t see: the inbound customer conversation. These systems often have no visibility into a customer’s real-time support interactions, service queries, or feedback provided through channels like WhatsApp Business or AI-powered web chats. This creates a fragmented customer profile and leads to jarring, context-blind experiences.
Imagine this common scenario: A customer spends thirty frustrating minutes with a support agent trying to resolve a delivery issue. Moments after the chat ends, they receive a cheerful push notification promoting a new loyalty program. This isn’t just a missed opportunity; it’s an actively damaging interaction that erodes trust and makes the brand appear deaf to its customers’ needs.
To solve this, enterprises have historically attempted complex and costly integrations. Stitching together a marketing automation platform with a separate customer service suite requires significant engineering resources, ongoing API maintenance, and a constant battle to synchronize data. This technical debt creates a fragile ecosystem where data lags are common and a truly unified customer view remains elusive.
A true Global Omnichannel Strategy requires more than just sending messages across App, Web, and WhatsApp. It demands a single source of truth where outbound marketing triggers and inbound service data coexist, allowing you to build Customer Journeys that are contextually aware and genuinely helpful, maximizing customer lifetime value.
The Power of a Unified Inbound & Outbound Platform
For years, customer communication has been fractured. Marketing teams managed outbound campaigns (push, email, SMS), while support teams handled inbound queries (tickets, live chat). In 2026, this siloed approach is no longer viable. Your retention analytics are incomplete if they don’t account for the entire customer conversation, from promotion to problem resolution.
True customer understanding emerges when you can see both sides of the coin. Imagine your analytics reveal a customer has a low satisfaction score from a recent support chat. A disconnected outbound system might blindly send them a generic promotional push notification—a move that feels tone-deaf and actively harms loyalty. This is where a unified platform becomes a game-changer.
The indigitall platform bridges this critical gap, creating a seamless ecosystem where marketing and support data enrich one another. This allows for the orchestration of truly empathetic and intelligent Customer Journeys. Instead of a clumsy promotion, that same low-CSAT customer could automatically receive a personalized apology and a recovery offer directly on their preferred channel.
Leadership in Native WhatsApp Integration
Nowhere is this unified power more evident than with WhatsApp. While many platforms still rely on third-party “wrappers” that create latency and limit functionality, indigitall is built on a native integration with the WhatsApp Business Platform. This isn’t just a technical detail; it’s a strategic advantage that unlocks unparalleled reliability and capability.
This deep integration means you can:
- Trigger AI-powered conversations from analytics. A high-value customer showing churn risk can be proactively engaged by a generative AI agent on WhatsApp, ready to solve issues or present a retention offer in real-time.
- Automate two-way interactions seamlessly. From order confirmations to support ticket resolutions, the conversation flows naturally without the delays or errors common in less sophisticated setups.
- Connect WhatsApp to a Global Omnichannel Strategy. A positive interaction on WhatsApp can trigger a follow-up push notification asking for a review or add a special loyalty pass directly to the user’s Mobile Wallet—all orchestrated from the indigitall console.
By unifying inbound and outbound communication streams, especially through powerful channels like WhatsApp, you transform your retention analytics from a reactive report into a proactive engine for building lasting customer loyalty.
Conclusion: Your Data is Telling You How to Grow
Throughout this guide, we’ve explored the critical metrics and strategies that define customer retention in 2026. The core takeaway is clear: sustainable growth is no longer about acquisition at all costs. It’s about deeply understanding your existing customers and using data to build lasting loyalty.
Effective retention requires a powerful combination—the right analytics to understand user behavior and the right tools to act on those insights instantly. Tracking LTV, Churn Rate, and RPR is essential, but these numbers are meaningless without a direct path to action. This is where the gap between data and results often lies.
This is precisely the gap indigitall was built to close. We make sophisticated customer retention analytics accessible and, most importantly, actionable for your entire team. Our unified platform doesn’t just show you what’s happening; it empowers you to instantly orchestrate a response across your entire digital ecosystem.
Imagine identifying a high-value customer segment at risk of churn and immediately launching an automated Customer Journey that engages them with a personalized offer via App Push, followed by a helpful message on WhatsApp. This seamless orchestration is the key to a proactive, Global Omnichannel Strategy, turning analytics from a reactive report into a real-time growth engine.
Ready to turn your customer data into your biggest growth asset? Schedule a demo of indigitall today and see how our unified platform can help you predict and prevent churn.